In the world of web analytics and conversion optimization, two commonly used metrics are bounce rate and exit rate. While they may sound similar, they measure very different aspects of user behavior on your website—which means they demand different approaches when it comes to improvement. In this 2025-ready guide, you’ll learn:
- What bounce rate and exit rate actually mean
- How they differ
- When each one matters (and when it doesn’t)
- A practical framework for deciding which one to fix first
- Strategies for improvement (aligned with modern analytics tools)
1. What is Bounce Rate?
Bounce rate measures the percentage of sessions in which a visitor lands on a page and then leaves the site without navigating to any other page or triggering any interaction event. Dataflo+3CXL+3Adobe Business+3
Key points:
- A “bounce” is a session with a single page view (and no other tracked interaction) in many analytics setups. Piwik PRO help center+1
- For example: if 1,000 people land on Page A and 300 leave without clicking on anything else or going to another page, the bounce rate is 30%. Shopify
- In modern analytics (for example Google Analytics 4 “GA4”), bounce rate may be defined in terms of “engaged sessions” rather than simply “single page views”. For example, GA4 defines a session as a bounce if it is not an “engaged session” (which means: fewer than 2 pageviews, no conversion event, shorter than ~10 s) Google Help+1
Why it matters:
Bounce rate is typically a proxy for how well your landing pages capture a visitor’s interest and encourage them to continue exploring. A high bounce rate may signal issues with relevance, page load speed, user experience, unwanted traffic, or simply mismatched intent. Dataflo+1
But a caveat:
A high bounce rate is not always bad. If a page serves a one-page purpose (e.g., a blog article that fully answers the query, a “thank you” page, or a single-page site), a high bounce rate might be entirely acceptable. Canonicalized+1
2. What is Exit Rate?
Exit rate measures the percentage of pageviews of a given page that were the last page in the session. In other words, of all the views that page had, how many times did the user leave the site from that page. Piwik PRO help center+1
Key points:
- Exit rate is defined for any page in the site, not just the landing (entry) page. Shopify+1
- Example: If Page B had 10,000 views and 2,500 of those views were followed immediately by the user leaving the site (i.e., Page B was the last page of the session), then the exit rate for Page B is 25%. FullSession
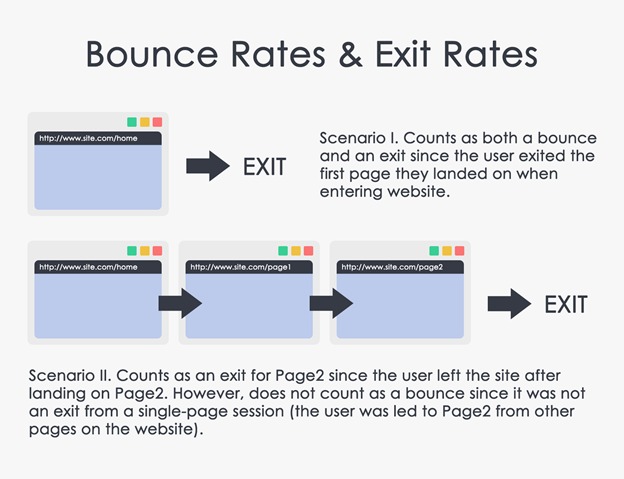
- Note: All bounces are also exits (because the session ends on that first page), but not all exits are bounces (because many exit pages are visited after multiple pages). CXL+1
Why it matters:
Exit rate gives insight into where in your flow or journey users tend to drop off. It’s useful for diagnosing problems later in the funnel, e.g., a product page, checkout step, or pricing page where users visit but then decide to leave. Hotjar
But again, a caveat:
A high exit rate isn’t automatically bad. On pages which logically should be the last page of a session (e.g., a thank-you or confirmation page), a high exit rate is expected and acceptable. Hotjar
3. Bounce Rate vs Exit Rate: The Differences
Here’s a side-by-side comparison of the two metrics:
| Metric | What it measures | Scope | Typical usage |
|---|---|---|---|
| Bounce Rate | % of sessions that start on a page and end without further interaction | Sessions‐that-only-view-one-page | Evaluate landing page / entry behaviour |
| Exit Rate | % of views of a page that are the last in a session | Page‐level, across all sessions | Diagnose drop-off / exit points in journey |
Key distinctions:
- Entry vs Exit: Bounce rate is about the start of a session (landing page). Exit rate is about the end of a session (exit page). Canonicalized+1
- Single page vs multi-page: Bounce rate deals with sessions of one page view; exit rate counts sessions that may have many page views but end on that page. Dataflo+1
- Interpretation differences: High bounce rate may imply poor landing page/irrelevant traffic. High exit rate may point to funnel leakage or a logical exit that’s fine. Omniconvert
4. So Which Should You Fix First? A Framework
Since both metrics are useful, deciding which to focus on first depends on your business goals, user journey, and where you see issues. Here’s a decision framework for 2025:
Step 1: Identify your funnel or key user journey
- Are you mostly concerned about first impressions (e.g., ad landing pages, organic search pages)?
- Or are you more concerned about funnel completion (e.g., product pages, checkout, trial signup)?
Step 2: Look at the metrics and segment accordingly
- On your main entrance pages (pages people land on from search, ads, referrals): examine bounce rate.
- On pages further down the journey (product detail, pricing, checkout, add-to-cart, etc.): examine exit rate.
Step 3: Prioritize based on magnitude and strategic importance
- If your landing pages show extremely high bounce rates (say > 70–80 % in a context where you expect multi-page navigation), and that is limiting traffic to your site, then bounce rate is your first fix.
- If your entry pages look okay (reasonable bounce rate) but your downstream pages have high exit rates (users arrive, explore, then leave before conversion), then focus on exit rate.
- Also consider business impact: How many conversions or goals are impacted by each page? Prioritize pages most tied to key goals.
Step 4: Contextualize
- Remember that high bounce or exit rate may be acceptable depending on page purpose. For example:
- A blog article might get most users landing, reading, then leaving—high bounce but maybe fine if the goal is article consumption.
- A thank-you page should have a very high exit rate (because the user is done).
Step 5: Set realistic targets, test & iterate
- Use benchmarks by page type and traffic source—don’t compare across wildly different page purposes.
- Use A/B testing (or multivariate) to validate changes.
- Use segmentation: traffic channel, device, landing vs returning user, etc.
Bottom line: You don’t fix one metric for all time. You fix the metric that aligns with your business problem and where the biggest improvement potential lies, then you shift focus as your site evolves.
5. Sample Scenarios for 2025
Here are examples to illustrate when you’d fix bounce rate first vs exit rate first.
Scenario A – Bounce Rate First
You run a content-driven site (blog, news). You’ve launched a paid ad campaign sending traffic to a “How-To” article landing page. Analytics show: high bounce rate (~85 %) on that landing page, very low engagement (few clicks to other articles). You suspect the ad headline promised one thing, the article delivers another, and users leave.
→ Fix the bounce rate: optimize landing page relevance, improve call-to-action to other content, reduce load time, align ad + landing page promise.
Scenario B – Exit Rate First
You operate an e-commerce site. Traffic from search lands on product pages with reasonable bounce rate (~45 %). But you notice a specific product page has a very high exit rate (~60 %) compared to others (~30 %). Users visit the page (maybe even add to cart) but leave from there.
→ Fix the exit rate: investigate product page UX, missing information, pricing confusion, shipping cost surprise, etc.
Scenario C – Combined Approach
You might have both issues: e.g., you notice overall bounce rate is high and also key checkout pages show high exit rate. In that case, you may need a dual approach: improve landing page to bring in relevant traffic and fix funnel drop-off points.
6. Strategies for Improvement (2025 Edition)
Here are tactics for improving each metric in modern analytics contexts:
Improving Bounce Rate
- Align incoming traffic (ads, social, search) with landing page content so user intent is met.
- Improve page load speed (mobile especially) — slow loading = higher bounce.
- Simplify navigation and encourage engagement (links to related content, clear next steps).
- Ensure mobile-friendly layout.
- Use interactive elements or events that count as engagement (to reduce false bounces in GA4).
- For single-page sites or content-only goals: track “engaged sessions” (time on page, scroll depth) instead of only bounce rate.
Improving Exit Rate
- Map user journeys and identify pages with high exit rates but high business importance.
- On pages with high exit rate: check for friction (complex form, unclear CTA, hidden charge, confusing UI).
- Use session recording/heat-maps (tools like Hotjar) to understand why users leave. Hotjar
- Improve internal linking and next steps (for pages where users should continue).
- In funnels (checkout/signup): simplify steps, reduce distractions, clearly show progress, reduce cognitive load.
- For pages that ought to be exits (thank you pages etc.), don’t worry about low exit rate—instead ensure proper tracking/measurement.
7. A 2025 Checklist for Prioritization
Here’s a practical checklist you can follow:
- Segment your traffic by channel (organic, paid, social, referral) and device.
- Identify pages with:
- High bounce rate (above your expected benchmark) AND key for business goals → flag for fix.
- High exit rate (especially on pages that should lead to conversion) → flag for fix.
- For each flagged page, ask:
- What is the page’s purpose? (entry, funnel step, standalone)
- What is the user intent when they land here?
- What traffic is coming in (channel, device, source)?
- Are technical/UX issues likely (page speed, design, mobile)?
- Prioritize based on business impact (traffic volume × conversion value × severity of problem).
- Implement changes (A/B test where possible).
- Monitor both bounce and exit rate (and other metrics like conversion rate, engagement rate) after changes.
8. Final Thoughts
In summary:
- Bounce rate and exit rate are not interchangeable—they measure different slices of the user journey.
- Use bounce rate mainly to evaluate landing pages (entry behaviour), and exit rate to evaluate where people leave in the journey.
- Which one to fix first?: Focus on the one that is misaligned with your goals and shows the biggest opportunity for improvement.
- Always interpret both metrics in the context of page purpose, traffic source, device, and business goal—because a “high” rate isn’t always inherently bad.
- Use a data-driven, prioritized approach rather than trying to “reduce all bounce and exit rates everywhere” blindly.
Leave a Reply