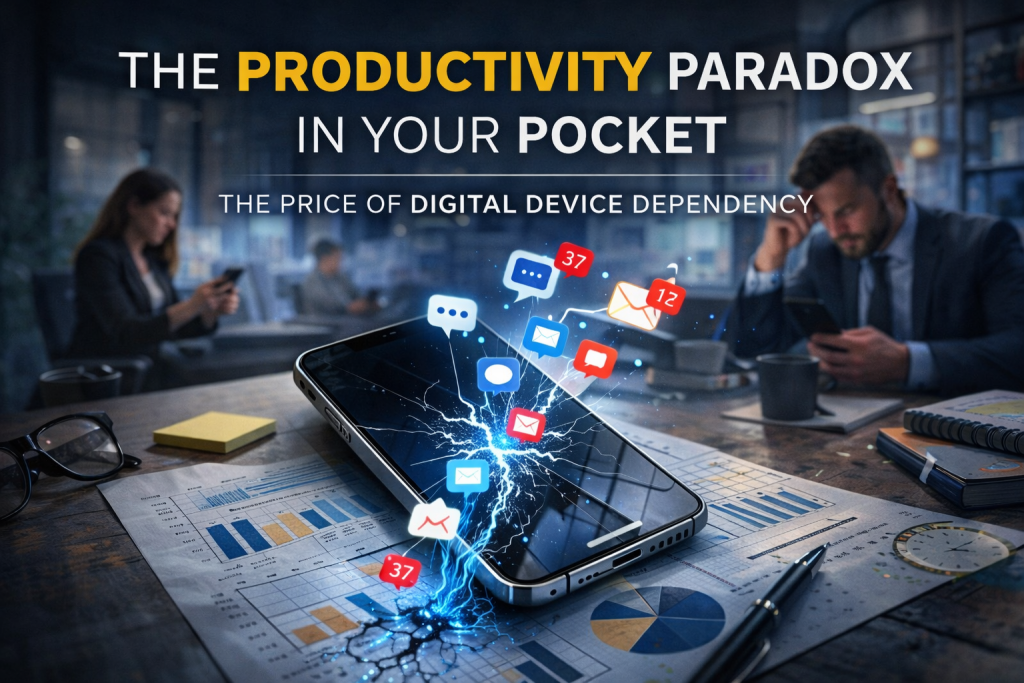
How Personal Digital Device Use Reshaped Work Performance — From Pagers to Smartphones
|
What Employers Aren’t Measuring — and Employees Hope They Never Do
by Jeremy Abram
If today’s productivity feels “off,” this book puts numbers and structure behind what most workplaces only sense:
digital distraction has become an operational cost. The Attention Leak breaks down how device-driven
fragmentation quietly reduces output, customer experience, and workplace credibility—across office, field, and remote roles.
It’s not a moral lecture—and it’s not “ban the phone.” It’s a practical, employer-and-employee readable framework for
identifying the leak, measuring it, and rebuilding focus culture in a way people will actually follow.
View the Book on Amazon →
(opens in a new tab)
|
Want a clear, personal baseline? I built a short Digital Device Dependency Assessment you can take in a few minutes to measure how often digital device habits are fragmenting your focus at work (office, field, or remote). It’s not a diagnosis tool — it’s a practical mirror: a score you can print/save, revisit over time, and use to guide realistic boundary changes that protect performance, credibility, and calm. Take the Digital Device Dependency Assessment here.
I. Introduction: The Invisible Cost Structure of Attention
In less than 30 years, the workplace transitioned from landlines and fax machines to smartphones, instant messaging platforms, wearable devices, and AI-powered assistants. What began as tools for connectivity have evolved into persistent attention competitors.
For employers reviewing this for policy, training, or strategic planning, the central question is not:
“Are phones distracting?”
It is:
What measurable productivity, safety, cognitive, and financial impacts occur when digital device usage is unmonitored or unmanaged?
This article examines:
- Historical productivity data before mobile digital saturation
- Research on interruption science and cognitive switching
- Field, office, and remote-work case studies
- Measurable financial impact estimates
- Abuse patterns and workarounds
- Legal mitigation strategies for employers
This analysis aligns with broader themes of technological friction, systemic tradeoffs, and hidden cost externalities — the same structural lens often explored in JeremyAbram.net’s technology essays.
II. Historical Baseline: Productivity Before the Always-On Era
A. Pre-Digital (Pre-1995)
Workplace structure before mass mobile adoption included:
- Fixed-location communication (landline telephones)
- Written memos and physical documentation
- Limited after-hours accessibility
- No push notifications
- No algorithmic feeds
Productivity measurement during this period focused on:
- Units produced per hour (manufacturing)
- Billable hours (professional services)
- Typing and clerical throughput
- In-person supervisory observation
Interruption frequency was largely environmental and visible.
B. Pager Era (Late 1980s–Early 2000s)
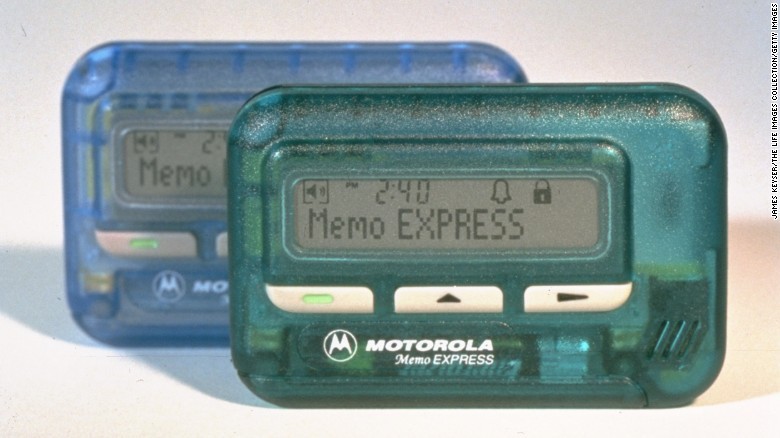
Pagers introduced:
- Asynchronous alerts
- Delayed response expectation
- Limited message content (numeric codes)
Importantly:
- Pagers did not offer entertainment.
- They did not provide scrolling feeds.
- They required a separate phone to respond.
Impact on productivity:
Interruption existed, but content depth was minimal. Cognitive diversion was short-lived.
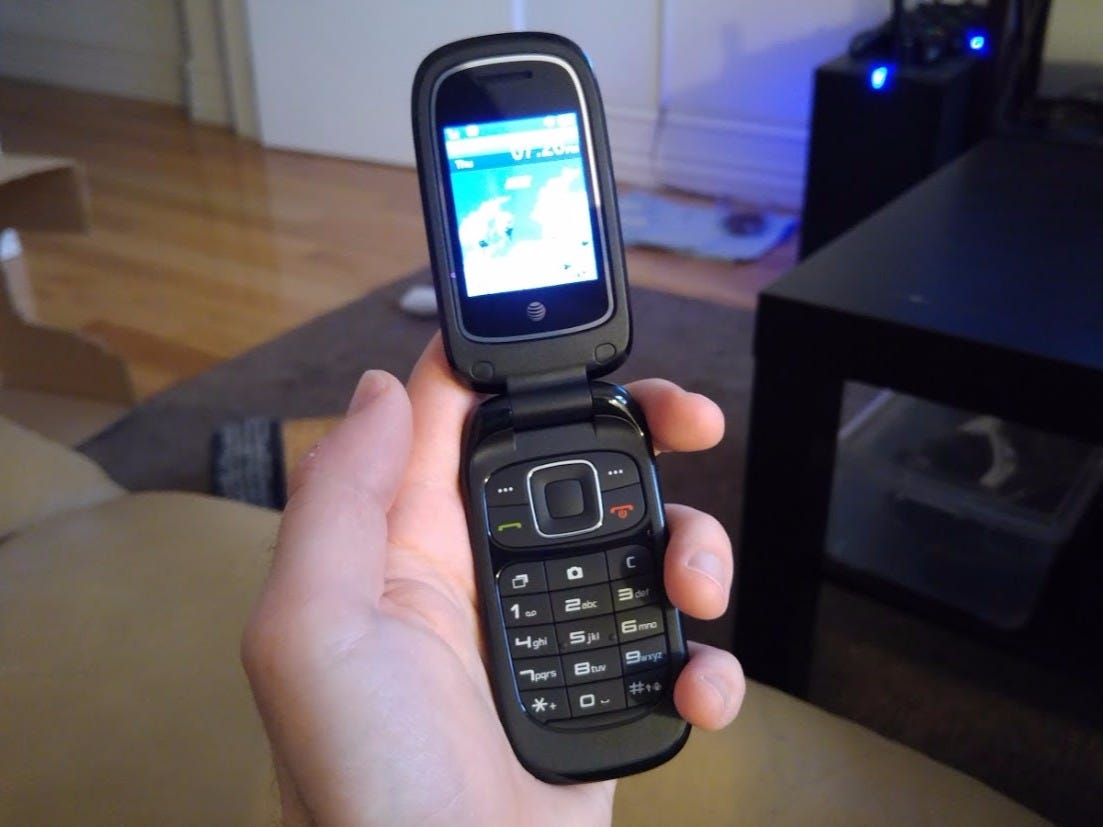
C. Early Mobile Phones (2000–2007)
|
|
What Employers Aren’t Measuring — and Employees Hope They Never Do
by Jeremy Abram
If today’s productivity feels “off,” this book puts numbers and structure behind what most workplaces only sense:
digital distraction has become an operational cost. The Attention Leak breaks down how device-driven
fragmentation quietly reduces output, customer experience, and workplace credibility—across office, field, and remote roles.
It’s not a moral lecture—and it’s not “ban the phone.” It’s a practical, employer-and-employee readable framework for
identifying the leak, measuring it, and rebuilding focus culture in a way people will actually follow.
View the Book on Amazon →
(opens in a new tab)
|
The BlackBerry era introduced:
- Email in pocket
- Limited SMS
- Basic web access
Work productivity initially improved in managerial and sales sectors due to real-time communication.
However:
- After-hours work expectations increased.
- Boundary erosion began.
D. Smartphone Era (2007–Present)

The launch of the iPhone (2007) marked a behavioral shift:
- Always-on internet
- Social media ecosystems
- Push notifications
- Algorithmically optimized attention loops
- Entertainment, shopping, gambling, and streaming in-pocket
This is where the productivity question becomes measurable and complex.
III. The Cognitive Science of Interruption
Research in cognitive psychology consistently shows:
1. Task Switching Costs
- Studies from the University of California, Irvine (Gloria Mark et al.) demonstrate:
- Average interruption recovery time: ~23 minutes
- Frequent task switching reduces deep work capacity
- American Psychological Association research indicates:
- Switching tasks can reduce productivity by up to 40%
2. Micro-Distractions vs Deep Work
Even brief glances at phones:
- Increase cognitive residue
- Fragment working memory
- Reduce analytical depth
Neuroscience research suggests:
- Dopamine-reward feedback loops reinforce compulsive checking
- Anticipation of notification reduces focus even without active checking
Key finding:
The mere presence of a smartphone in view can reduce available cognitive capacity (Ward et al., 2017, Journal of the Association for Consumer Research).
IV. Quantifying Workplace Impact by Sector
A. Office & Knowledge Work
Common Patterns:
- Social media scrolling
- Messaging apps
- Personal email
- News feeds
- Online shopping
Estimated Productivity Loss:
- Various corporate analyses estimate 1–3 hours/day lost to non-work phone usage.
- If a $30/hour employee loses 1 hour/day:
- $30/day
- ~$7,500/year per employee (250 workdays)
For a 100-employee company:
- ~$750,000/year potential productivity leakage
These are conservative estimates and do not include:
- Error rates
- Rework
- Reduced innovation depth
B. Field Work & Industrial Settings
Risks expand beyond productivity:
- OSHA reports identify distraction as a contributing factor in injuries.
- National Safety Council data shows cell phone distraction linked to:
- Equipment mishandling
- Vehicle incidents
- Reduced situational awareness
Financial impact includes:
- Workers’ compensation claims
- Insurance premium increases
- Litigation exposure
One industrial case study (construction sector) showed:
- 18% drop in minor incident reports after phone restriction policy implemented.
C. Remote Work Environment

|
|
What Employers Aren’t Measuring — and Employees Hope They Never Do
by Jeremy Abram
If today’s productivity feels “off,” this book puts numbers and structure behind what most workplaces only sense:
digital distraction has become an operational cost. The Attention Leak breaks down how device-driven
fragmentation quietly reduces output, customer experience, and workplace credibility—across office, field, and remote roles.
It’s not a moral lecture—and it’s not “ban the phone.” It’s a practical, employer-and-employee readable framework for
identifying the leak, measuring it, and rebuilding focus culture in a way people will actually follow.
View the Book on Amazon →
(opens in a new tab)
|
Remote work amplifies the challenge:
- Lack of physical supervision
- Blurred home/work boundary
- Multi-device environment (TV, tablet, phone)
Stanford research (Nicholas Bloom et al.) found:
- Productivity depends heavily on self-discipline and monitoring structures.
Digital distraction in remote settings often:
- Extends work hours
- Reduces effective hourly output
- Increases burnout
The paradox:
Employees may work longer — yet produce less focused output per hour.
V. Hidden Economic Externalities
A. Consumer Price Inflation
When productivity drops:
- Companies absorb cost
- Or pass cost to consumer
If productivity decreases 5–10% across sectors:
- Output per labor dollar declines
- Prices adjust upward
This hidden cost of distraction:
- Is distributed across entire markets
- Rarely attributed directly to digital device misuse
B. Insurance and Liability Costs
Distracted employees:
- Increase accident probability
- Increase compliance violations
- Increase HR investigations
This translates into:
- Higher premiums
- Legal defense costs
- Settlement payouts
VI. Abuse Methods & Common Workarounds
For employers reviewing risk:
Common concealment patterns include:
- Phone under desk usage
- Smartwatch notification scanning
- Bathroom break extension scrolling
- Bluetooth earbuds disguised as compliance devices
- “Research” browser tabs masking entertainment
- Secondary device (personal phone alongside company device)
- Remote workers using mouse-mover software
These behaviors:
- Are often normalized culturally
- Escalate when boundaries are unclear
VII. Legal Mitigation Strategies for Employers
Employers must balance:
- Productivity protection
- Employee morale
- Legal compliance
- Privacy law
1. Clear Policy Drafting
Policies should:
- Define acceptable use
- Clarify break-time allowances
- State monitoring practices
- Include safety rationale
2. Monitoring (Where Legal)
Options:
- Network-level monitoring
- Device management software
- Restricted WiFi segmentation
- Geofencing in industrial settings
Employers must comply with:
- State privacy laws
- Federal labor regulations
- Notice requirements
3. Behavioral Interventions
Research shows:
- Total bans often fail culturally.
- Structured usage windows perform better.
Examples:
- Device lockers in manufacturing
- Scheduled personal device check breaks
- Phone-free meetings
- Incentivized productivity blocks
4. Environmental Redesign
- Reducing notification culture
- Encouraging deep work sessions
- Restructuring performance metrics around output, not presence
VIII. The Ethical Complexity
Digital devices are not purely negative:
They:
- Increase responsiveness
- Improve emergency communication
- Enable remote flexibility
- Support family coordination
The issue is unmanaged use.
The system-level insight:
The tool designed for connection became a competitor for human attention.
IX. Global Economic Scope
If we conservatively estimate:
- 1 hour/day lost globally
- 1 billion knowledge workers affected
- Average wage $20/hour globally
Daily productivity loss:
$20 billion/day
Annualized (250 workdays):
$5 trillion+
Even if overestimated by 50%, the macroeconomic impact remains staggering.
X. The Prelude to a Larger Examination
This article establishes:
- The cognitive science foundation
- The historical transition
- The economic implications
- The abuse mechanisms
- The mitigation frameworks
A full-length book could expand into:
- Industry-specific breakdowns
- Legal case law analysis
- Insurance modeling
- Behavioral addiction science
- Cultural normalization studies
- International regulatory comparisons
- Consumer price impact modeling
- Technology design ethics
- Corporate surveillance risks
Final Reflection
The question is not whether phones reduce productivity.
The question is:
How much, in what contexts, and at what systemic cost?
For employers, ignoring the issue may mean:
- Silent revenue erosion
- Increased liability
- Cultural decay of focus
For employees, unmanaged use may mean:
- Reduced career growth
- Cognitive fragmentation
- Long-term professional stagnation
For society:
It may mean we are unknowingly pricing distraction into everything we buy.
|
|
What Employers Aren’t Measuring — and Employees Hope They Never Do
by Jeremy Abram
If today’s productivity feels “off,” this book puts numbers and structure behind what most workplaces only sense:
digital distraction has become an operational cost. The Attention Leak breaks down how device-driven
fragmentation quietly reduces output, customer experience, and workplace credibility—across office, field, and remote roles.
It’s not a moral lecture—and it’s not “ban the phone.” It’s a practical, employer-and-employee readable framework for
identifying the leak, measuring it, and rebuilding focus culture in a way people will actually follow.
View the Book on Amazon →
(opens in a new tab)
|
Want a clear, personal baseline? I built a short Digital Device Dependency Assessment you can take in a few minutes to measure how often digital device habits are fragmenting your focus at work (office, field, or remote). It’s not a diagnosis tool — it’s a practical mirror: a score you can print/save, revisit over time, and use to guide realistic boundary changes that protect performance, credibility, and calm. Take the Digital Device Dependency Assessment here.